
Plan Right with
GanttRight.
From Tasks to Timeline in No Time.
Built to feel intuitive, easy to navigate, and quick to edit. Lay the work out as cards on the Task Flow board, turn it into a timeline you can grab and drag on the Gantt Chart, and keep the details behind any single task in the Task Inspector. Three views, one plan, and controls that do what you expect the first time you try them.
Plan your project now.
- Windows desktop
- Files stored on your machine
- No cloud storage
- 30 days free with no card
- One payment, no subscription
- Sold through the Microsoft Store
Simple to Use
Project management software has an earned reputation for being punishing. GanttRight was built the other way around — for people. It works like planning a project with physical notes. Start with each task on a card and the Gantt chart becomes the easy part.
Tasks are cards you can move
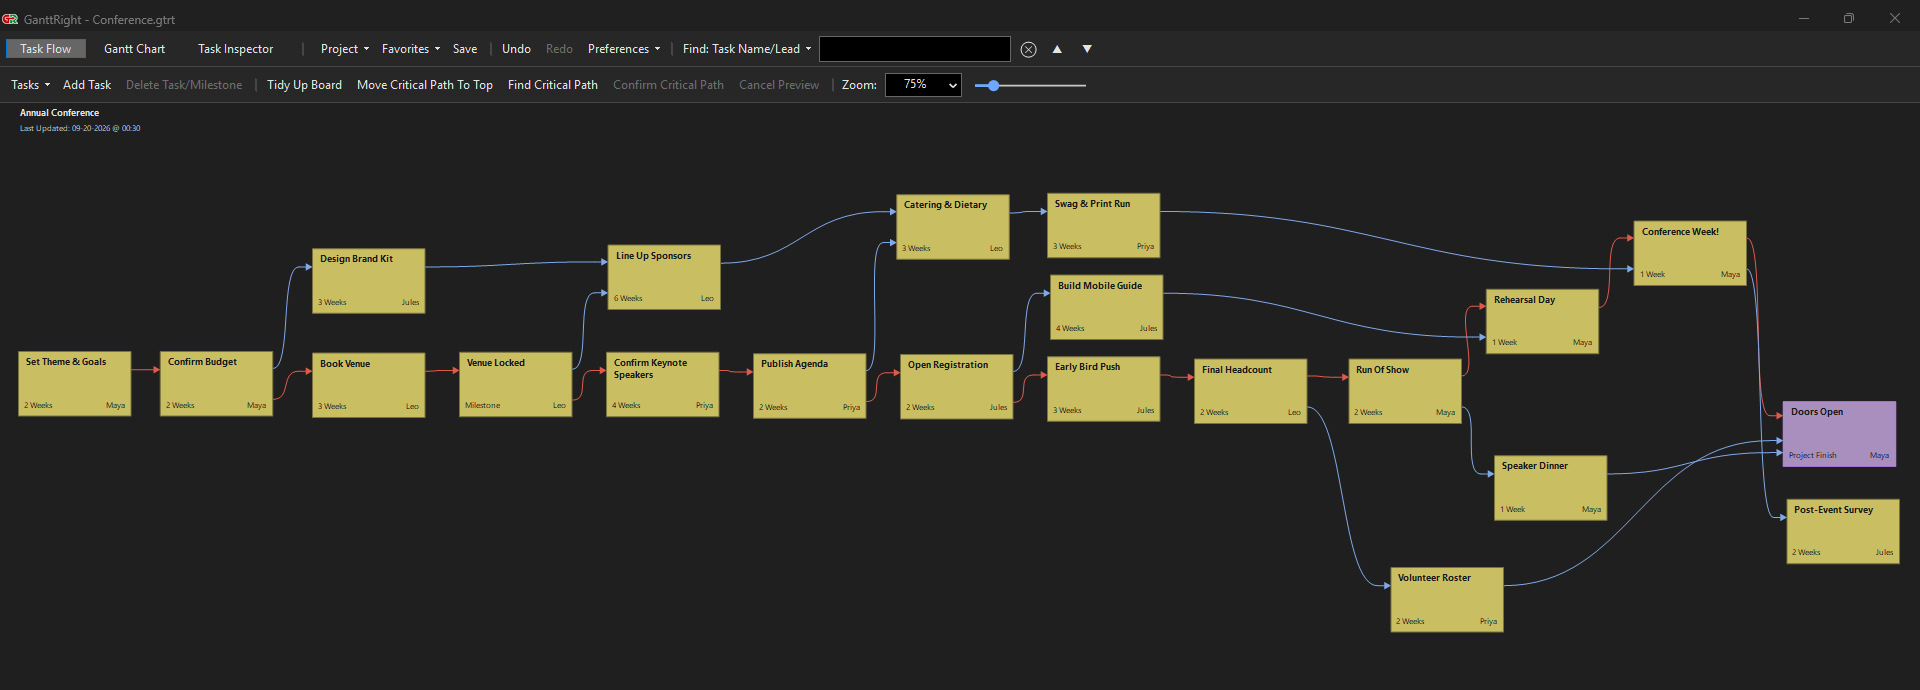
Everyone who has ever planned anything properly has done it with sticky notes on a wall: one note per job, shuffled around until the order is right. Task Flow is that wall. Each task is a card you pick up and put where it belongs. The arrows between them are the string you would have run between the notes. Nothing is filed away in a dialog you have to go looking for.
What you see, you can change
If it is on the screen, you can put your hands on it. The bar is the duration — drag its edge. The arrow is the dependency — pull it somewhere else. The slack is a track with two ends you can push. When a number is what you want instead, type it straight into the row: hours and cost are all editable cells. Nothing real is hidden in a dialog you have to go and find.
Controls that make sense, views that agree
Drag to create, drag to move, drag to link. A link that cannot work turns red and tells you why before you let go, so you are never guessing what the software wants. And the three views are genuinely one plan — change something on the board and the chart already knows, because there is nothing to sync and nothing to rebuild.
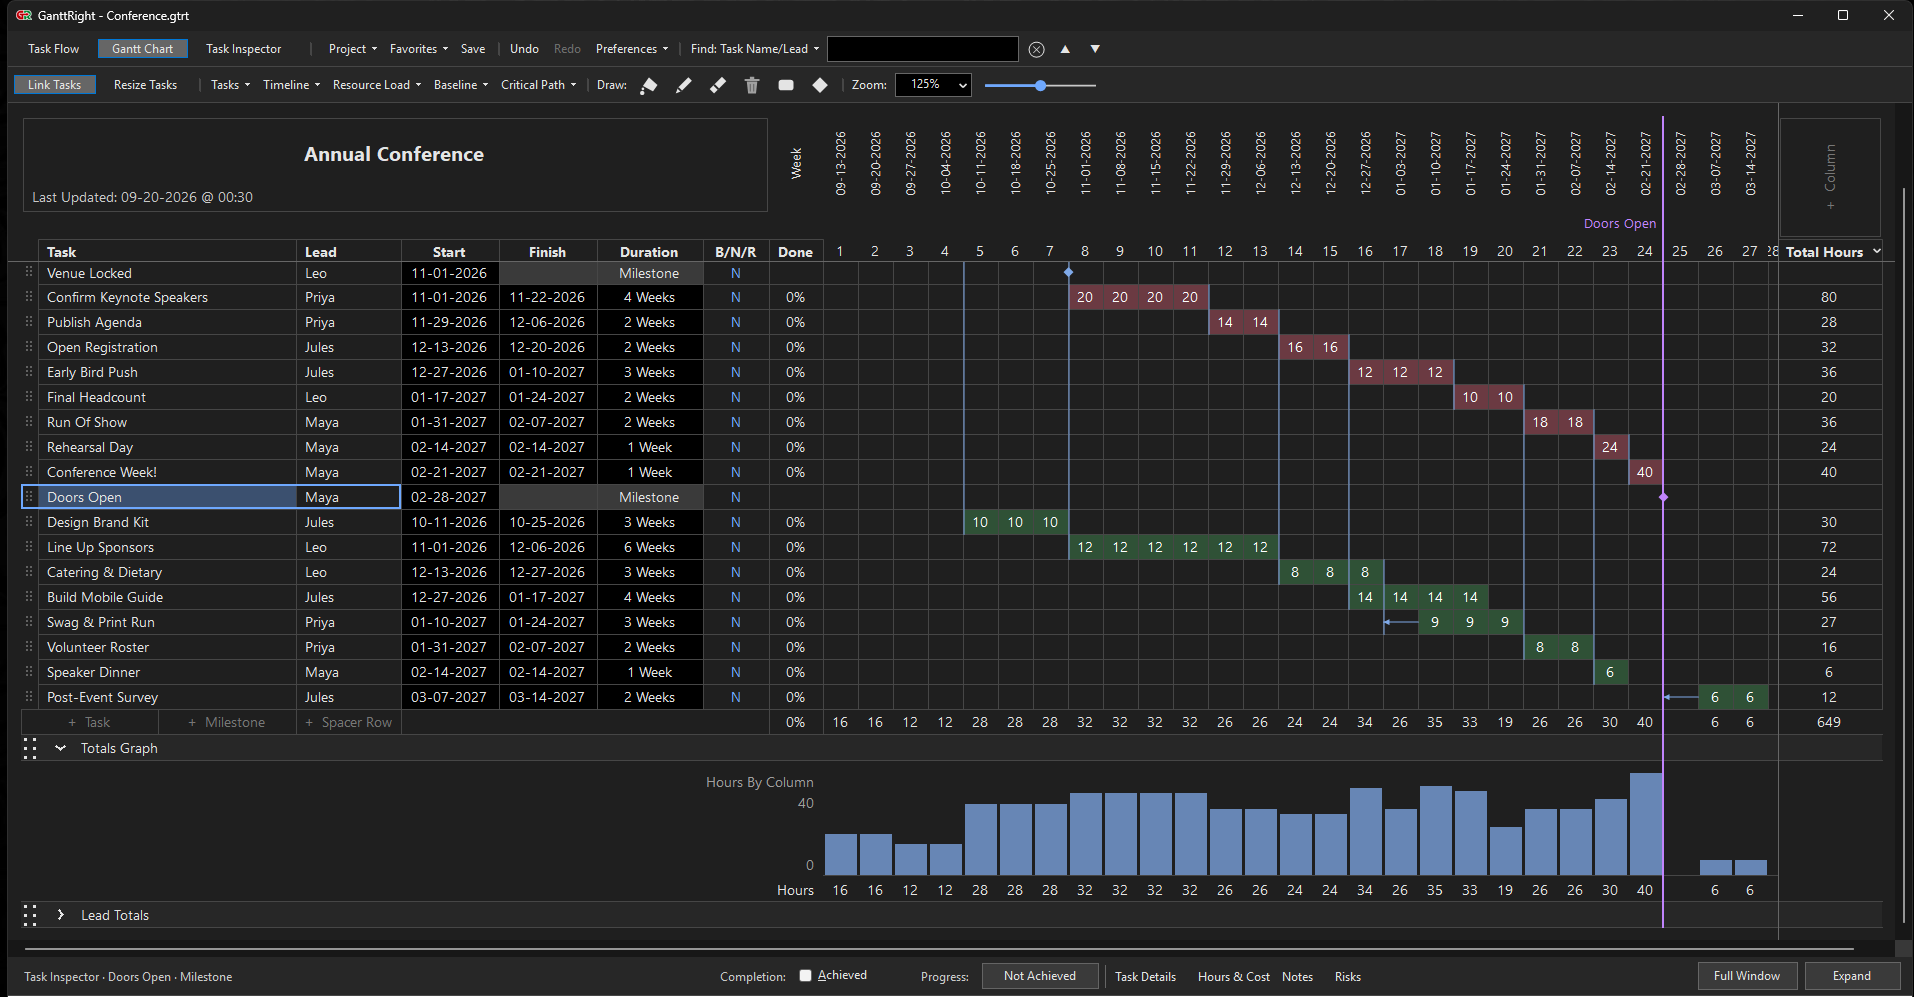
- Critical — the longest path to project completion
- Floating — has room to move
- Milestone — a moment to hit
1 Plan: 3 Views That Agree
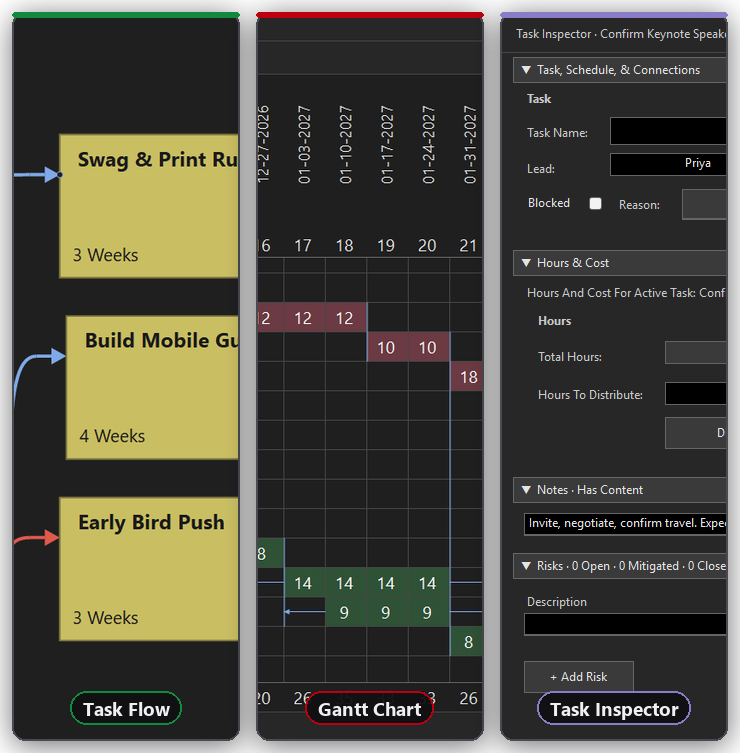
Most tools give you a chart and a table of the same rows. GanttRight gives you three genuinely different stages of one plan. The board shapes it, the chart schedules it, the Inspector fills in the details. None of them is a read-only picture of another.
What Feeds What
Task Flow
The board. Cards and arrows, left to right, with no calendar in sight. This is where a plan gets its shape — and where Plan First lets you work before a single date exists.
When It Happens
Gantt Chart
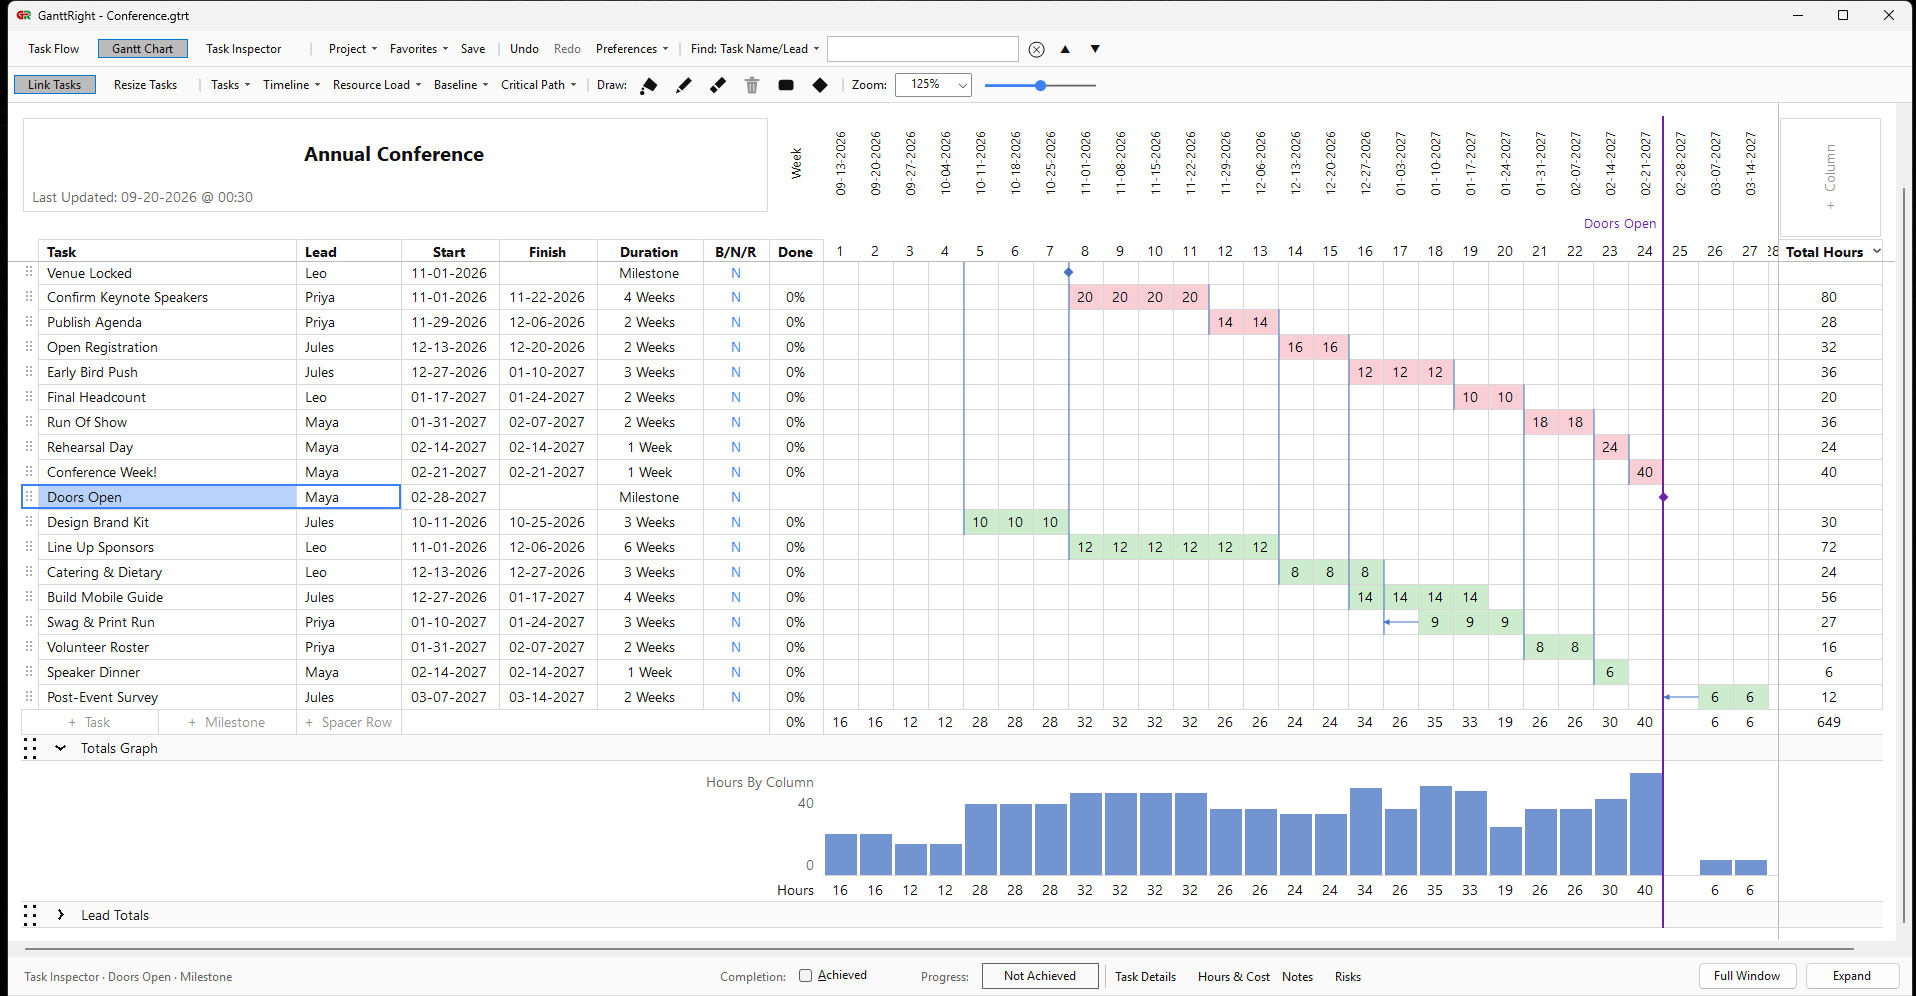
The timeline. Paint bars across a time period, pull arrows between them, and highlight the critical path whenever you want it. Float shows up as track you can grab, not a number in a column.
Everything Else About the Task
Task Inspector
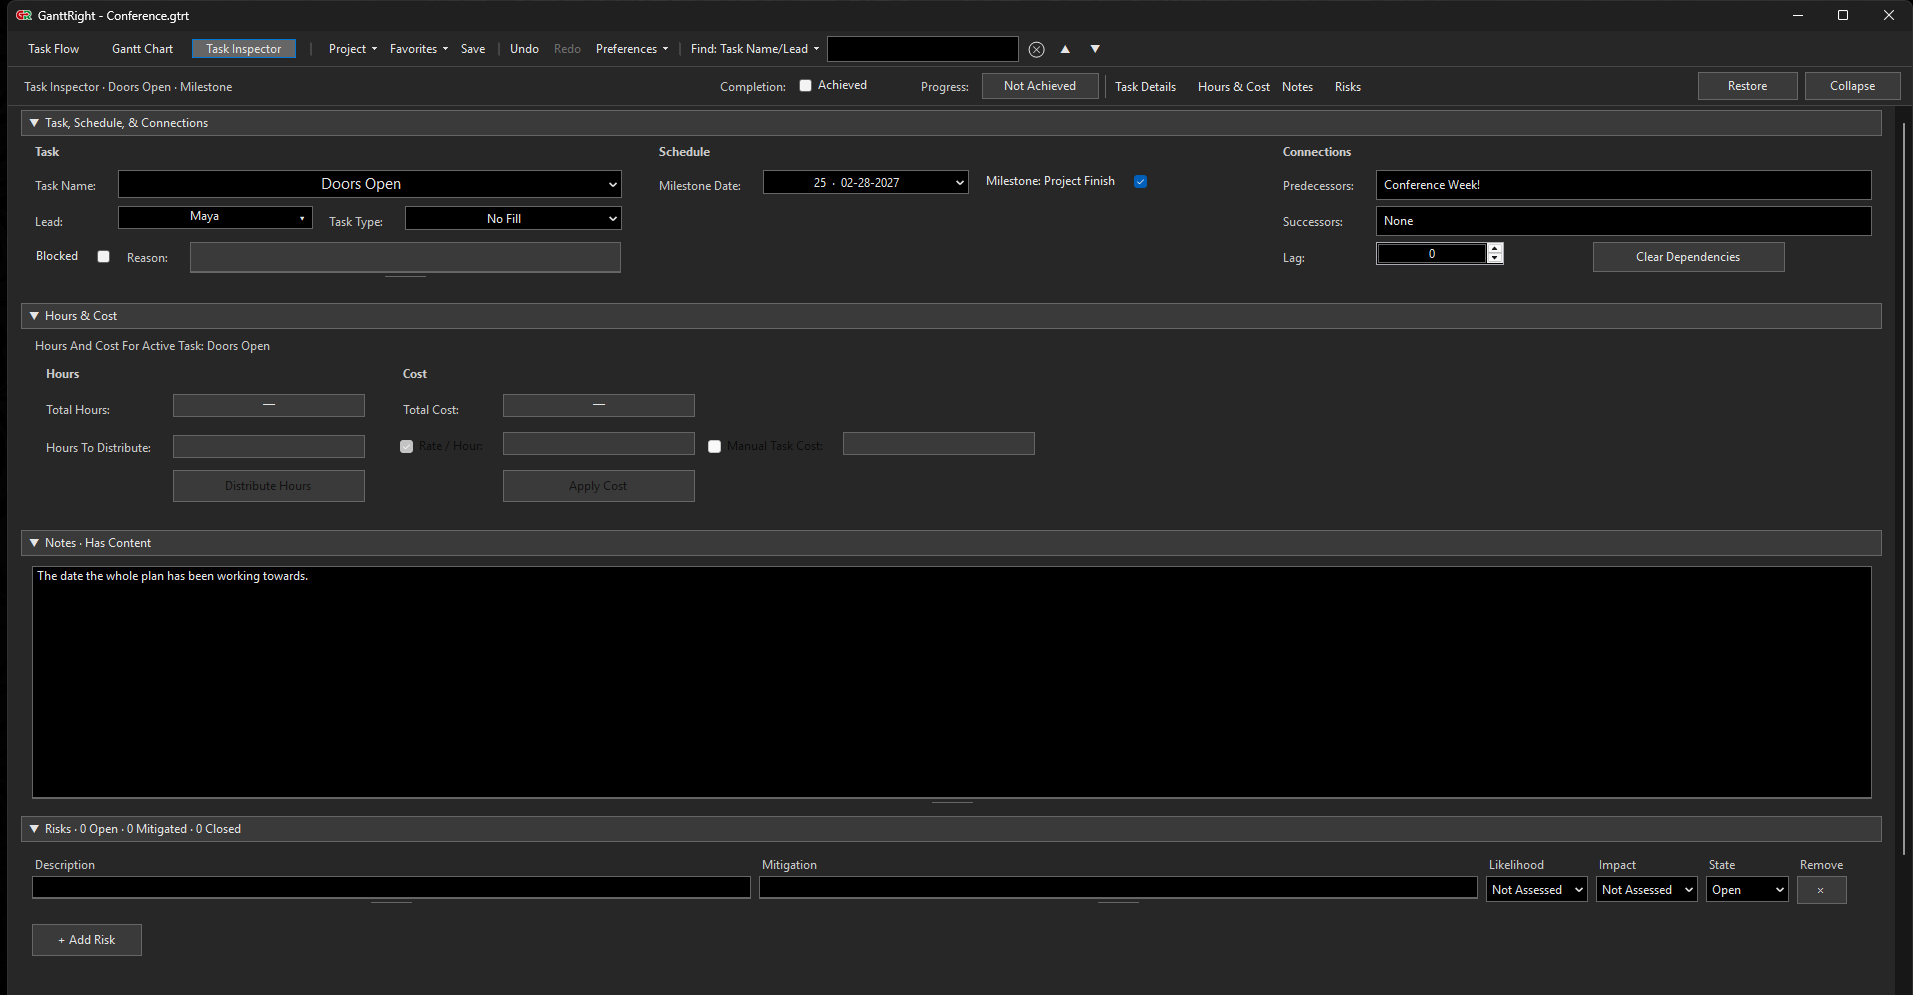
One task, in full. Lead, schedule, hours and cost, notes, risks, and blocked state — the details that turn a bar into something a person can actually act on.
Everything you shape on the board arrives in the chart already linked. The rules that refuse an impossible link are the same throughout, so nothing has to be checked twice. The Inspector opens on whatever task you have selected.
The Critical Path Builds the Chart
A board full of cards is not yet a schedule. What turns one into the other is working out which run of tasks has no slack anywhere along it, because that run sets the earliest the project can possibly finish. GanttRight treats that calculation as the main event rather than a report you run at the end.
The path comes out of the arrows you drew
Plan First lets you name tasks and connect them with no dates at all. Build Schedule then reads those connections, previews real dates for everything still unscheduled, and applies them as one step. The sequence you arranged by hand is what produces the timeline, so the first chart you see is already shaped like your plan.
Color and row order are the answer, not decoration
Confirm Critical Path classifies every task as Critical or Floating, and that classification is what the pink and the green mean. Move Critical Path To Top then lifts the deciding chain into the upper rows and arranges the floating branches beneath it. Reading the chart from the top down lets you quickly see what tasks can and cannot float.
Find the new path in one pass
Drag a bar or add a task and the longest run may no longer be the same one. Auto-Reorganize Tasks Around Critical Path finds the new path, confirms it, moves it back to the top, and closes the gaps that opened behind it. You preview the whole thing before anything changes and it applies as a single undo.
A Plan in 5 Steps with GanttRight
Nothing to configure before you can see anything. Five steps take you from an empty window to a plan with a critical path. Only the first one changes depending on how you start.
Choose How to Start, Then Name the Work
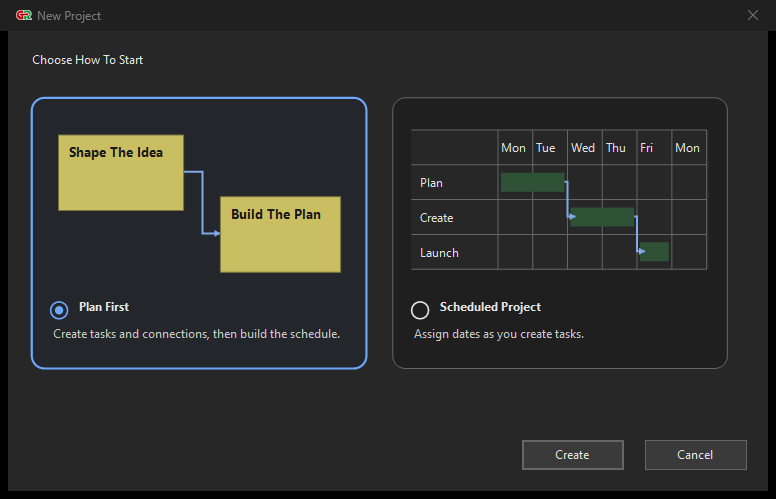
New projects open one of two ways and you pick on the way in.
 When you do not know the dates yet
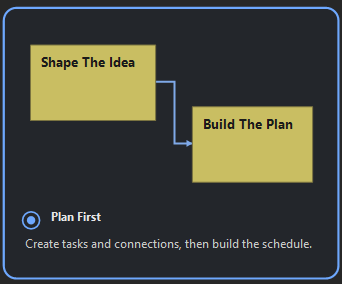
You land on an empty Task Flow board. Name the work, one card per job, and draw the arrows that say what has to happen before what. Give rough duration estimates. When the shape is right, Build Schedule previews real dates and applies them in one step.
 When the dates are already fixed
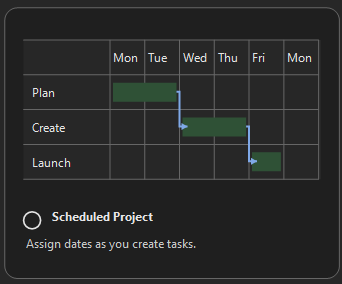
You land on the Gantt chart with three one-hour tasks to build from. Drag across the weeks and the work is dated the moment it exists, then pull the arrows between the bars.
Find the Critical Path
One click traces the chain that decides your finish date and colors it. That is your longest path to completion. It is the only part of the plan where a day lost is a day lost off the end.
Adjust Floating Tasks, Hours, and Costs with the Gantt Chart
Confirm the path and everything off it turns green with the room it has. Push a bar inside its slack, change the hours in a cell, and watch the totals and costs move in real time as you do it — not after a recalculation you had to ask for.
Add Notes, Risks, and Details with the Task Inspector
One task, in full: lead, schedule, hours and cost, notes, risks, and blocked state. This is where a bar on a chart becomes something a person can actually act on.
Review Resource Load with the Totals Graphs and Lead Totals
Turn on Resource Load and check nobody is quietly doing three jobs in the same week. Lead totals and the totals graphs show where the effort has actually landed — before you promise the date, not after.
Easy to Read
A plan nobody else can read is half a plan. That applies to the chart on your screen just as much as to the document you send out, so both are built to be understood by someone who has never used the software.
Readable over someone's shoulder
Pink is what cannot slip, green has room, a diamond is a date that matters, and the arrows point the way the work flows. That is the whole legend. Nobody has to be taught a notation, study a key, or decode a color scheme to see where the trouble is — which is the point of drawing a plan rather than tabulating it.
The plan survives leaving the screen
Print the chart or export it as an image and it stays legible on paper, in an email, and on the wall of a site office. Export the data as CSV when somebody wants it in their own tools.
The questions you get asked
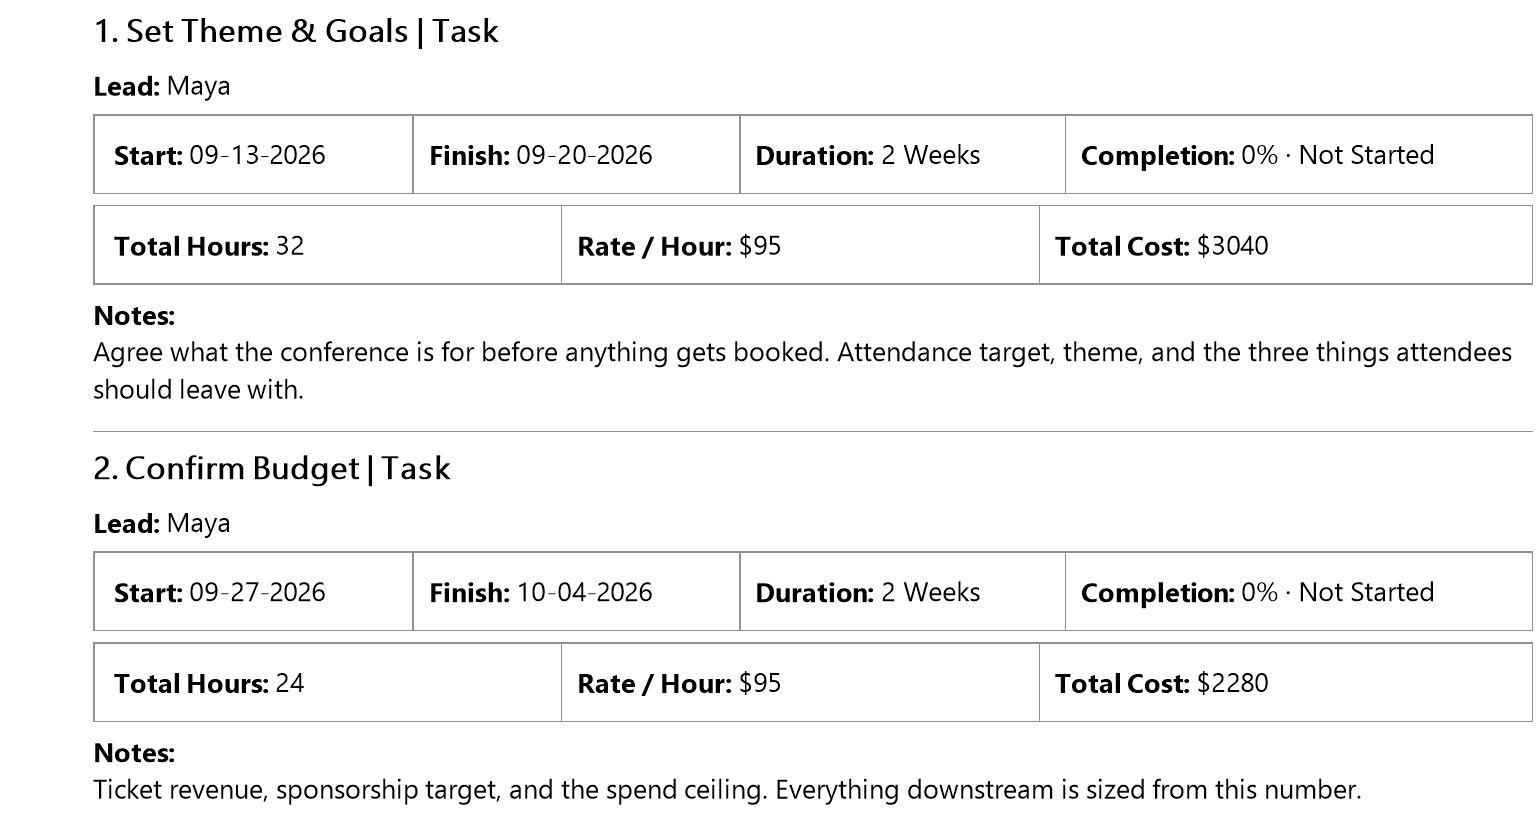
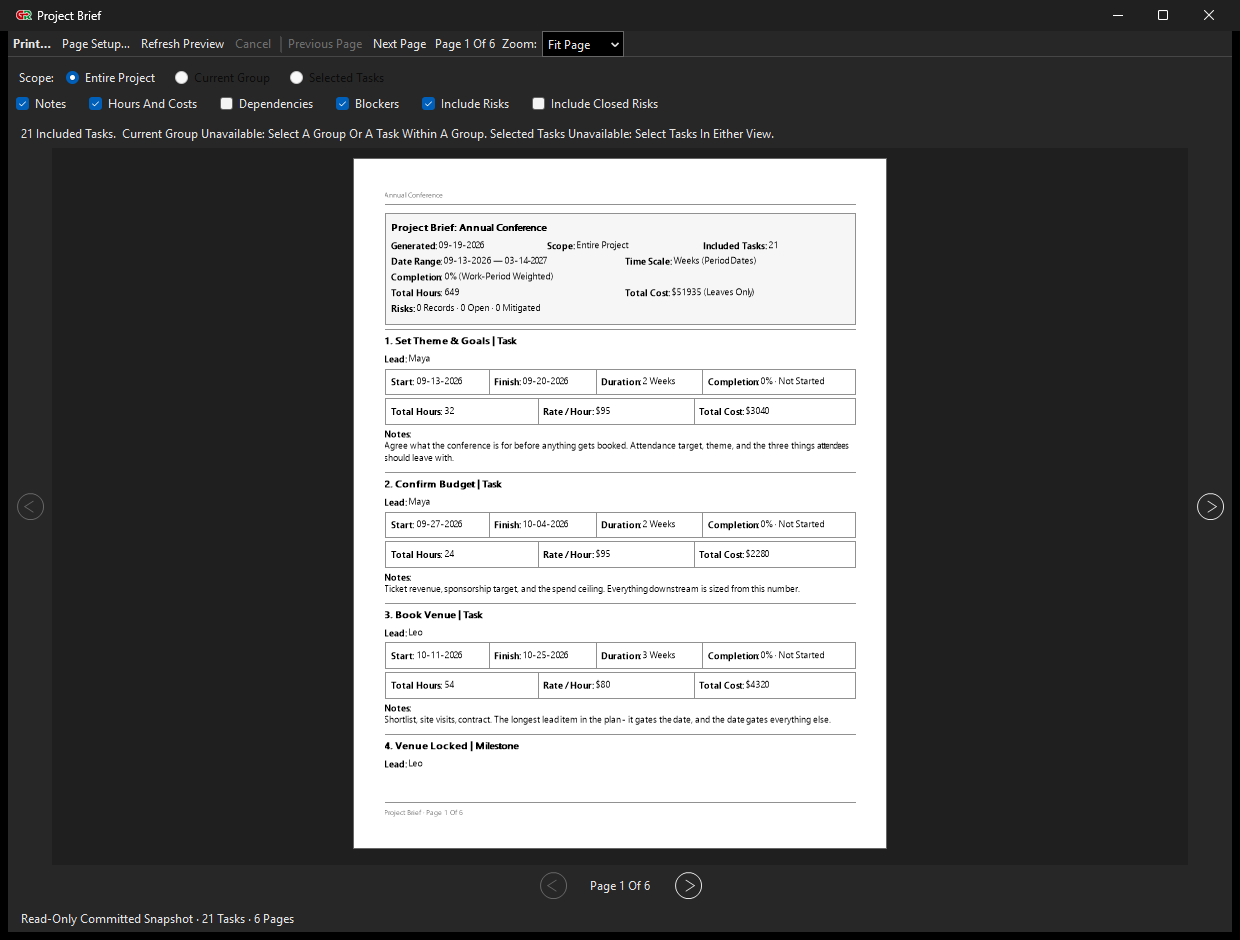
Report status, dependencies, blockers, risks, notes, and hours and costs. Choose which sections go in — including whether closed risks are shown — so a board pack and a site update come from the same plan without being the same document.
Laid out to print
Paginated with a live preview, page navigation and zoom, on Letter or A4. What you see in the preview is what comes out of the printer. Export the chart as an image or the data as CSV when someone wants it in their own tools.
Screenshots
Click any image for a closer look. GanttRight matches your Windows theme on first launch, in light or dark, and you can set either one yourself at any time. View different aspects of the software up close.
Your GanttRight Plan Is a File

.gtrt
One .gtrt file on your own disk — this is what it
looks like sitting in your folder. Keep it wherever your work already lives.
Back it up the way you back up everything else. It is yours, it is
local, and nothing else is required to open it.
There is no GanttRight account to create and no workspace to be invited to. There is no subscription either — the file is simply yours.
Your plans never leave your computer: the software has nowhere to send them. Buying through the Microsoft Store uses your Microsoft account and Windows keeps the license, exactly as it does for every other app you install there.
Built for the solo project planner
One person, one plan, one project at a time. No accounts to set up, no permissions to configure, no workspace to administer — you open the file and plan. When someone else needs to see it, send them the Project Brief or the file itself. It is a single-planner tool by design, so a team editing one chart together is a different job from the one this does.